Inverse Head And Shoulders
- Inverse Head And Shoulders
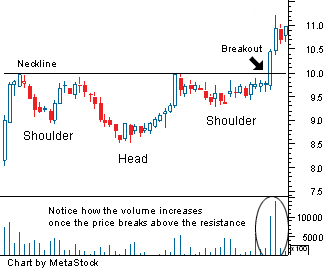
- A chart pattern used in technical analysis to predict the reversal of a current downtrend. This pattern is identified when the price action of a security meets the following characteristics:
1. The price falls to a trough and then rises.
2. The price falls below the former trough and then rises again.
3. Finally, the price falls again, but not as far as the second trough.
Once the final trough is made, the price heads upward toward the resistance found near the top of the previous troughs. Investors typically enter into a long position when the price rises above the resistance of the neckline. The first and third trough are considered shoulders, and the second peak forms the head.

This pattern is also known as a "reverse head and shoulders" or a "head and shoulders bottom".
As you can see from the chart above, a move above the resistance, also known as the neckline, is used as a signal of a sharp move higher. Many traders will watch for a large spike in volume to confirm the validity of the breakout. This pattern is the opposite of the popular head and shoulders pattern, but is used to predict shifts in a downtrend rather than an uptrend.
Investment dictionary.
Academic.
2012.
Look at other dictionaries:
head and shoulders — In technical analysis, a pattern that results where a stock price reaches a peak and declines; rises above its former peak and again declines; and rises a third time but not to the second peak, and then again declines. The first and third peaks… … Financial and business terms
Double top and double bottom — are reversal chart patterns observed in the technical analysis of financial trading markets of stocks, commodities, currencies, and other assets. Double top Double top confirmation The double top is a frequent price formation at the end of a bull … Wikipedia
Neckline — A level of support or resistance found on a head and shoulders pattern that is used by traders to determine strategic areas to place orders. Each peak of a regular head and shoulders pattern falls toward a support level, also known as a neckline … Investment dictionary
Isaac Newton — Sir Isaac Newton … Wikipedia
Australia — /aw strayl yeuh/, n. 1. a continent SE of Asia, between the Indian and the Pacific oceans. 18,438,824; 2,948,366 sq. mi. (7,636,270 sq. km). 2. Commonwealth of, a member of the Commonwealth of Nations, consisting of the federated states and… … Universalium
Autism — This article is about the classic autistic disorder; some writers use the word autism when referring to the range of disorders on the autism spectrum or to the various pervasive developmental disorders.[1] Autism … Wikipedia
JPEG — For other uses, see JPEG (disambiguation). Joint Photographic Experts Group A photo of a cat compressed with successively more lossy compression ratios from right to left Filename extension .jpg … Wikipedia
Commodity Channel Index — The Commodity Channel Index (CCI) is an oscillator originally introduced by Donald Lambert in an article published in the October 1980 issue of Commodities magazine (now known as Futures magazine). Since its introduction, the indicator has grown… … Wikipedia
Chart Formation — A graphical depiction of a stock s price movements over time. Technical analysts use chart formations to identify trends in a stock s price and to help them decide whether and when to buy and sell that is, to determine entry and exit points.… … Investment dictionary
List of professional wrestling terms — Professional wrestling has accrued a considerable amount of slang, in references and jargon.cite web|url=http://www.pwtorch.com/insiderglossary.shtml|title=Torch Glossary of Insider Terms|publisher=PWTorch.com|accessdate=2007 07 10|date=2000]… … Wikipedia

